

The map of a common sky
Major European observatories started using telegraphs to gather weather data during the nineteenth century.
This led to many arguments about how best to standardize data; for example, should temperatures be recorded in Fahrenheit or Celsius? Nevertheless, by sharing data, standard and accurate instruments were vital as well. European weather maps slowly became commonplace.
In February 1855, the leader of the Paris Observatory Urbain, le Verrier, presented Napoleon III with a plan to turn the telegraph network into a weather network by placing weather stations close to existing telegraph stations. This "weather telegraphy network" could then warn mariners of approaching storms. The emperor approved and half a year later a network of thirteen weather stations regularly telegraphing to the Paris Observatory had been established in France.
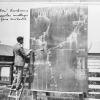
Le Verrier soon sought partners in other countries and former adversaries Russia were the first to sign on. By 1858, the Paris Observatory was exchanging regular weather reports not only with St. Petersburg, but with colleagues in Vienna, Geneva, Brussels, Turin, Rome, Madrid, and Lisbon. This exchange was gradually extended to other European countries as well. The Paris Observatory started to publish <a href="http://entreprise.meteofrance.com/content/2010/5/23241-43.JPG">daily weather maps of Europe in 1863</a> depicting isobar lines (lines of equal barometric pressure) that looked very similar to today's weather maps.
In 1873, ten years and two wars after the first weather map from the Paris observatory, the International Meteorological Organization (IMO) was founded in Vienna to co-ordinate the study and exchange of weather information. Like a number of international organizations, the International Meteorological Organization was reformed as an agency of the United Nations, the World Meteorological Organization (WMO), in 1950, and currently has its headquarters in Geneva.
How to cite this page
Alexander Badenoch, 'The map of a common sky', Inventing Europe, http://www.inventingeurope.eu/story/the-map-of-a-common-sky
Sources
- Edwards, Paul N. A Vast Machine: Computer Models, Climate Data, and the Politics of Global Warming. The MIT Press, 2010.